Menu
Publications
The ACPCC’s research team (in collaboration with our key partners) continues to undertake research and evaluation of public health activities supporting cervical cancer elimination in Australia and internationally, with outcomes published in peer-reviewed journals and health-care focussed articles.
Search publications:
Authors:
Zammit, C.M
Creagh, N.S
McDermott, T
Smith, M.A
Int. J. Environ. Res. Public Health 2022, 19, 15776.
Authors:
Thompson EF
Hoang L
Höhn AK
Palicelli A
Int J Gynecol Cancer. 2022 Aug 1;32(8):977-985. doi: 10.1136/ijgc-2021-003251. PMID: 35764349.
Authors:
Talia KL
van der Griend R
Pathology. Volume 55. Supplement 1, S3, February 2023
Authors:
Talia KL
Ratnayake G
McCluggage WG
International Journal of Gynecological Pathology 42(5):p 496-499, September 2023. | DOI: 10.1097/PGP.0000000000000915
Authors:
Talia KL
McCluggage WG
Pathology. 2023 Apr;55(3):269-286. doi: 10.1016/j.pathol.2023.01.003. Epub 2023 Jan 21. PMID: 36759286.
Authors:
Talia KL
McCluggage WG
International Journal of Gynecological Pathology 42(1): p 70-77, January 2023. | DOI: 10.1097/PGP.0000000000000873
Authors:
Talia KL
Banet N
Buza N
Pathology. 2023 Feb;55(1):8-18. doi: 10.1016/j.pathol.2022.11.004. Epub 2022 Nov 23. PMID: 36503635.
Authors:
Sullivan, S.
Sadewo, G.
Brotherton, J.
Kaufman, C.
Infect Control Hosp Epidemiol . 2023 Aug;44(8):1334-1341. doi: 10.1017/ice.2022.243. Epub 2022 Oct 20.
Authors:
Park KJ
Selinger CI
Alvarado-Cabrero I
Duggan MA
Int J Gynecol Pathol. 2022 Nov 1;41(Suppl 1):S64-S89. doi: 10.1097/PGP.0000000000000909. Epub 2022 Aug 19. PMID: 36305535.
Vaccine 2022 Sep 2;40(37):5413-5432. doi: 10.1016/j.vaccine.2022.06.065. Epub 2022 Aug 12.
Authors:
Kreimer AR
Cernuschi T
Rees H
Brotherton JML
JNCI: Journal of the National Cancer Institute, Volume 115, Issue 3, March 2023, Pages 246–249
Authors:
Jane L Goller
Jacqueline Coombe
Meredith Temple-Smith
Helen Bittleston
BMJ Open 2022;12:e067488. doi:10.1136/ bmjopen-2022-067488
Authors:
Hull B
Hendry A
Dey A
Brotherton J
Commun Dis Intell 2022;46 Epub
Authors:
Garland SM
Iftner T
Cuschieri K
Kaufmann AM
J Clin Virol . 2023 Feb:159:105349. doi: 10.1016/j.jcv.2022.105349. Epub 2022 Dec 8.
Authors:
Butler TL
Lee N
Anderson K
Brotherton JML
PLOS ONE
Authors:
Lawton B.
MacDonald EJ
Storey F
, Stanton JA
JMIR Res Protoc . 2023 Sep 14:12:e51643. doi: 10.2196/51643.
READ UP ON IT
Related News Article
ACPCC launches the Inaugural Victorian Cancer Screening Annual Statistical Report. The Australian Centre for the Prevention of Cervical Cancer is pleased to announce the launch of the Inaugural Victorian Annual Cancer Screening Statistical Report….
Monday, 26 February 2024. The Allan Labor Government is calling on Victorians to make sure their cancer screenings checks are up to date in a major push to boost screening rates for breast, bowel…
Australia is stepping up its regional leadership in the elimination of cervical cancer, with the announcement today of a $12.5 million Australian Government grant to a consortium of leading Australian and international nongovernment health organisations….
Australia is stepping up its global leadership in the elimination of cervical cancer, with the announcement today of a $12.5 million Australian Government regional aid grant to a nongovernment consortium headed by the Daffodil Centre, a joint…
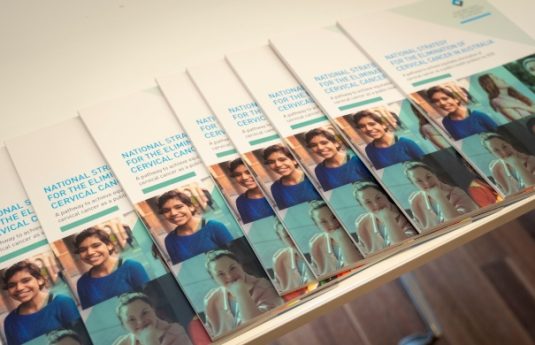
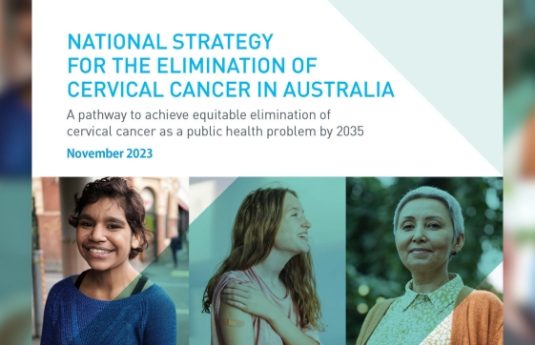
The C4 is thrilled about the announcement today by the Australian Government of the release of the National Strategy for the Elimination of Cervical Cancer and a $48.2 million investment to support implementation of…
On Friday 17th November, Cervical Cancer Elimination Day of Action 2023, the C4 hosted the first ECC2023 (previously named the Preventing Cervical Cancer Conference [PCC]). The theme of the conference was ‘From Prevention to…
This cervical cancer awareness week, the Australian Government has launched a landmark strategy set to make preventable cervical cancer a disease of the past, setting Australia on the path to becoming the first country…
Australia is stepping up its regional leadership in the elimination of cervical cancer, with the announcement today of a $12.5 million Australian Government grant to a consortium of leading Australian and international nongovernment health…
The Albanese Labor Government is leading the way for Australia to become the first country in the world to eliminate cervical cancer, with the release of the National Strategy for the Elimination of Cervical…
I’m delighted to be here today for such an historic event in Australian medical history. Before I begin, I’d like to acknowledge we’re meeting today on the lands of the Wurundjeri Woi-wurrung people of…
Previous
Next
DONATIONS
Make an Individual Donation
Et has minim elitr intellegat. Mea aeterno eleifend.Et has minim elitr intellegat. Mea aeterno eleifend.Et has minim elitr inte
llegat. Mea aeterno eleifend.Et has minim elitr intellegat. Mea aeterno eleifend.Et has minim elitr intellegat. Mea aeterno eleifend.
READ UP ON IT
Success Stories
Providing access to immunisation for vulnerable groups (PAIVnG). Refugees and asylum seekers arrive in…
The ROSE Foundation, a collaboration between ACPCC and the University of Malaya, integrates the…
ECCWPThe Elimination of Cervical Cancer in the Western Pacific (ECCWP) project goal is to…
Get in touch
To find out more about what we do or how we can work together, please get in touch.


